Hiking, Weight Distribution, Area Under the Curve
Lesson Plans > Mathematics > Calculus > IntegrationHiking, Weight Distribution, Area Under the Curve
When I get to the end of the school year, if I have some time left over in my Pre-Calculus class, I begin introducing the fundamental ideas of Calculus. We don't go into great detail or depth; I merely want to show them some of the reasons why Calculus is important in real world applications. I often have students who tell me that they want to be doctors, nurses, or physical therapists, who are surprised that Calculus can relate to such fields. The discussion below helps to illustrate how calculus relates to the human body.
I have a great deal of overlap between my Physics class and my Pre-Calculus class, which is helpful, because I can occasionally draw from lessons in one class, and develop them further. This is one such lesson. In Physics class we do a lesson I've written up here: Hiking Poles. That lesson should be read first, before continuing here.
One of the things that we do in Physics class is, we break down my gait into a series of moments, measure the amount of weight my poles support at each of those moments, and then average them. This is a very rough approximation, since each cycle of my gait takes about a second, and we've only measured the weight distribution at four instantaneous moments during that second. If we were going to graph our measurements over time, it would look like this:
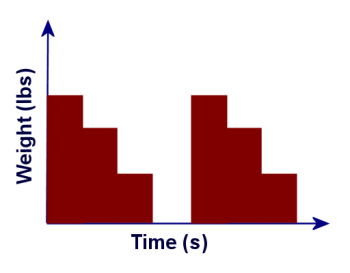
The longest bar represents the weight supported by my poles when they are in front of me; the mid-sized bar represents the weight supported by my poles when they are even with my center of gravity; the shortest bar is when the poles are behind me, and the place where there is no bar represents the time interval at which the poles are in the air.
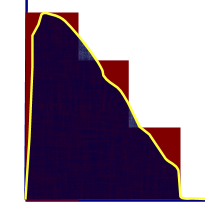
From here, the students can see that the average weight supported by my poles is the red area over a full cycle, because we average the four weights, and averaging the four weights is the same as multiplying each of them byWith all of this as background, I ask my students which sections of the graph are really an accurate portrayal of what is happening over that entire time interval. It doesn't take long before they figure out that the only interval accurately represented by the graph is the interval over which the poles are in the air. For each of the other intervals, since my body is in motion relative to the poles, my weight is in a state of constant redistribution, resulting in a continuous curved graph rather than our block graph. I ask students to create their own theory about what that graph might look like. We discuss the graphs, and come to a combined conclusion that the actual graph looks like this:
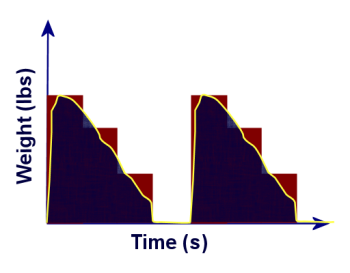
The very steep portion of the yellow line at the beginning represents the very brief time interval in which the poles go from not touching the ground to supporting the maximum weight. Then the weight supported by the poles gradually declines until the moment at which I lift them off the ground, and the supported weight drops to zero.
So how could we get a more accurate reading of the weight supported by my poles? By breaking this graph into narrower rectangles. I demonstrate this process on the board by showing how if we had twice as many rectangles, each rectangle would have a height close to the curve's height at that point, and each rectangle would be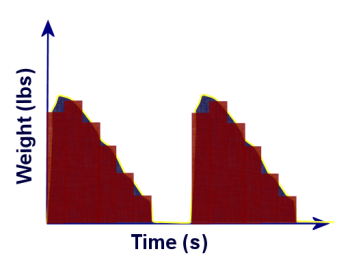
And, of course, just as we can get more accurate readings of a slope by doing ever more narrow intervals, we can get a more accurate reading of the area under a curve by doing ever more narrow rectangles. This simple example helps my students understand why being able to find the area under a curve might be valuable, and it also gives a simple visual for why advanced mathematics can be helpful to people in fields like physical therapy. It's easy to find online studies of patients doing treadmill walking with body support harnesses to help carry some of their weight; the mathematics behind optimizing training regimens makes use of calculus concepts.


