Ask Professor Puzzler
Do you have a question you would like to ask Professor Puzzler? Click here to ask your question!
In a previous post, Kathryn from Florida wanted help figuring out how long her house would be under Hurricane Irma. I gave her a rough formula to use, with the strong disclaimer that this was approximate, and should not be used as a means for determining any course of action. The formula turned out to be a reasonable guideline, and for the few days leading up to the hurricane's passage, that blog post became one of the most popular pages on The Problem Site. I'm glad I was able to provide useful information to so many people.
The formula, which you can find developed here: Hurricane Passage Approximation Formula, is T = 2SQR(R2 - D2)/V, where:
- R is the radius of the hurricane
- D is the distance of the closest passage of the eye to your home
- V is the velocity
- T is the time you can expect to be under the storm
The formula required you to take a "snapshot" of the hurricane at a given moment, and make the assumption that the hurricane's size, shape, speed, and direction remain unaltered during its journey up the coast. None of these assumptions are perfect, of course, and some were "less perfect" than others.
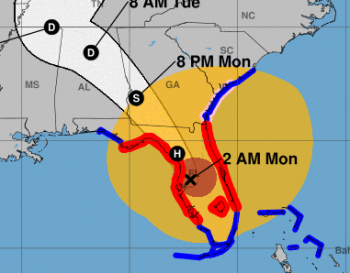
If you watched the hurricane passing up the coast of Florida on weather maps, you could see very clearly some of the reasons that this formula should only be used as a rough approximation. Most of the reasons can be summarized by this screenshot of a National Weather Service hurricane map (click it for a larger version). The red circle represents the region that is currently under hurricane force winds (at least 74 mph sustained winds). The larger circle represents tropical storm force winds (between 39 and 73 mph winds). This image was captured at 8:00 Monday morning. The map was updated every three hours for the duration of the storm.
Here are some of the noteworthy ideas that this image (and others in the sequence of updates) shows us:
- The formula given makes the assumption that the storm is circular. Irma was roughly circular for most of its lifespan, but as it worked its way up the coast of Florida's peninsula, it became much more elliptical in shape, stretching out wider and wider. Since the storm was wider east-to-west than north-to-south, and it was traveling in a roughly northerly direction, if you were using its widest extents as your R, the storm's passage would have been shorter than the formula predicted.
- In addition, although the eye was fairly central to the storm during much of its passage through the Caribbean, before it made landfall in Florida, the storm's internal structure had changed significantly; the tropical storm force winds had shifted to being largely to the north east of the eye. You can clearly see this change in the image; the X and the red portion of the hurricane are far to the west and south of what we would call the "center" of the storm. Thus, if you used the closest approach to the eye as your D (distance), you're using the wrong point. To be more accurate, the formula would require you to know the approach angle of the storm, as well as the extents (we'd call it the "diameter" if it was circular) of the storm perpendicular to the approach angle. This information would be used to more accurately pinpoint a "center." Of course, the more information you have to collect to use the formula, the less likely it is that you'll be able to use it. As it stands, someone on the east coast of Florida who used that formula will probably find that they were under the storm for longer than the formula suggests, while someone directly under the eye would find that the storm didn't last as long as the formula suggests.
- By comparing this image to others I saw through the passage of the storm, it's clear that the storm was continually changing in size. In this image, by doing some rough line-drawing and measuring on Google Earth, I was able to estimate the maximum extents of the tropical storm winds at about 575 miles, which is significantly different from what it was when it reached Kathryn's city. Three hours later, it was about 50 miles wider at its widest point. We knew this would happen, of course, but I confess that, as someone who is not a meteorologist, I didn't expect the storm's size to change as quickly and as significantly as it did. Even so, there isn't any good way to work this possibility into a simple formula. When the time under the storm is more than 24 hours, that's a lot of time for the hurricane's structure to change.
- Similarly, the speed of the hurricane has also been changing during the passage up the coast, though this was by far the least significant of the changes; my recollection is that the storm's speed only fluctuated by ±3 mph.
- Another thing which could have happened (but didn't) - the storm could have done a drastic change in direction. Imagine you were almost all the way through the storm, and suddenly it shifted direction (the way Jose is doing out at sea right now), and backtracked over you. You'd be in the storm much longer than the formula could predict.
All of these points contribute to the emphasis that this formula is a very rough approximation. Of course, nobody was looking for an exact prediction - people were more interested in knowing whether they'd be under the storm for a few hours, a few minutes, or a few days. For all its simplistic faults, the formula gave an excellent guideline for anyone living on the Florida peninsula.
The hurricane could have been far worse than it was; every time the hurricane came in contact with land, it lost energy, and any time it wasn't in contact with land, it started revving up again*. A much more destructive course would have been: the hurricane passes by Cuba just a few miles further north, and then passes up west of the Florida peninsula, to make landfall around Tampa. As it was, Irma churned up a lot of energy in Cuba - dropping from Cat 5 to Cat 3 as it devastated that island, and then continuing to expend its wrath on the less-populous Monroe and Collier counties before reaching Tampa as a Cat 1 hurricane. It's easy to forget (but should not be forgotten) that Tampa's "good fortune" in this regard comes at the cost of life, property, and livelihood of people further south, both in and out of the United States.
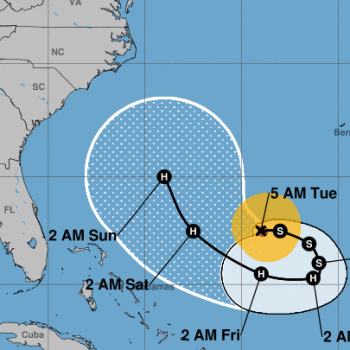
* Keep an eye on Hurricane Jose, which (as of 5:00 AM, Sept 12) is just churning in circles in the Atlantic. It's currently very small, and predicted to drop below hurricane level shortly. But as it continues to wheel about over the sea, it is predicted to regain hurricane status before heading back in the general direction of the Carolinas.
I saw the most bizarre video this morning - it was a video that purported to "prove" that hurricanes Katia, Irma, and Jose don't exist, and are being "manufactured" by the government. I'm not sure exactly how this is supposed to work - maybe they use mind-control techniques to convince people that their homes have been destroyed by a massive hurricane. Or maybe everyone in the Caribbean islands is on the payroll - they're being paid to stand in front of cameras and say that they've been hit by a hurricane, and..oh...wait...the background shows demolished houses. So they're being paid to demolish their own houses and say it was a hurricane that did it. I wonder how much money it would take to pay off an entire caribbean island (just one - never mind that there are several of them!).
The "evidence" for the video's claim was a looped image from weather.gov. I've included a still of the animation that I captured this morning. You can click it to see a larger version.
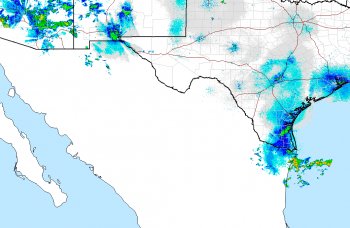
This is a looped animation from weather.gov. It's their "CONUS" animation. It is clear that Hurricane Katia doesn't exist, because - look at the coast of Mexico - there's nothing there!
There are two things about this map that I'd like to point out.
- The video author probably should have asked the question "What does CONUS stand for?" The answer is: "Continental U.S." In other words, this is a map of U.S. states. Not Mexico, not the Caribbean.
- Even if you didn't realize that CONUS stood for "Continental U.S.", you probably should have asked yourself, "Why does Mexico have no weather whatsoever?" Amazing, isn't it, how only the United States gets "weather" - once you cross over the border into Mexico, weather ceases to exist.
This is terribly disturbing. There are people in the paths of these hurricanes who need to not be led by conspiracy theorists who have no idea what they're talking about. In the last week, I've seen all of the following:
- The hurricanes are being manufactured by the government
- The hurricanes don't exist at all
- The hurricanes are no big deal - the media is being overly dramatic to "promote global warming." As a note on this: If someone tells you the hurricanes are no big deal, and then evacuate the state, but can't bring themselves to say, "I'm sorry, I was wrong - I'm taking this hurricane seriously enough that I'm evacuating, and you should take it seriously too," don't you think it's time to start listening to someone else?
- Hurricane Irma is a Category 7 hurricane. Hurricanes are rated on a 5 category scale. There has been some discussion (which has gone nowhere at this point) or increasing it to a 6 category scale, but category seven not only doesn't exist - it isn't even being discussed.
- Hurricane Irma is on a direct path to Houston. This was a popular "news" item floating around facebook while Irma was still far out in the Atlantic. There were no hurricane models that were suggesting a Houston landfall, so this was 100% someone's twisted fantasy.
- Hurricane Jose is on a direct path to New England. This popular "news" is apparently based on a weather image (perhaps photoshopped?) which was posted by a twitter user without any documented reference. While it is true that Jose is currently still active and expected to regain hurricane status, and could head north, it is irresponsible to base your information entirely around a random twitter user's random undocumented image.
- Footage from previous hurricanes being passed off as Irma footage. You might think this is harmless fun, but it's not. For a conspiracy theorist, all it takes is one piece of fake footage to prove that all the footage is fake (I know - that's about as irrational as saying "I saw a painting once, so now I know that nothing is real." But nobody said rationality and conspiracy theories go hand-in-hand). So when you post faked footage, you are helping a conspiracy theorist convince some poor, gullible soul that the hurricane threatening his neighborhood is a hoax.
Folks, if you're in the path of a hurricane, stop watching you tube videos, twitter, facebook memes, and lazy local websites that are more interested in clicks than facts. Tune in to what your local emergency officials are telling you. This is not a joke.
The preceding has been a public service announcement from a very cranky and irate Professor Puzzler, who wants people to be safe. Thank you.
This week, hurricanes are on everyone's minds. In the aftermath of Hurricane Harvey, Hurricane Irma has become one of the most powerful hurricanes (currently at 185 mph sustained winds) in recorded history, and is bearing down on the Caribbean Islands, and is expected to make landfall in Florida.
I received a question from a Florida resident today. Kathryn would like to know how long she can expect to be in Hurricane Irma. Before I answer the question, I would like to make one thing very clear:
Disclaimer: this should not be taken as a scientific or meteorological prediction, and should under no circumstances be taken as any sort of recommended course of action. It is provided merely as a matter of curiosity.
Kathryn, instead of simply giving you a number, I'm going to develop a formula, to calculate the length of time. I realize you may not be interested in the mathematics behind the answer; if you aren't, you can simply skip to the bottom of the post where I use the formula to give you your answer.
The tricky part of answering this question is that the amount of time you are "in" the hurricane depends not just on the size and speed of the hurricane, but also how far from the center or eye of the storm you are. For example, if you pass directly through the center of the storm, you'll be under the storm for much longer than if the center of the storm passes 100 miles from your house. You'll still be under the storm, but not for as much time. So to answer the question, we'll need to know how far the eye is passing from your house. We'll call that distance D.
In developing the formula, we'll use several variables. Although we know how big Irma currently is, and how fast it is currently traveling, we don't know that those will be the conditions when the hurricane makes landfall. So instead of using 405 miles as the diameter, or 15 mi/hr as the speed, I'll use R for the radius of the hurricane, and V for the velocity. So when the hurricane approaches, if you can find updated data about the hurricane, you can plug those numbers into the formula.
Okay, now let's take a look at a picture.
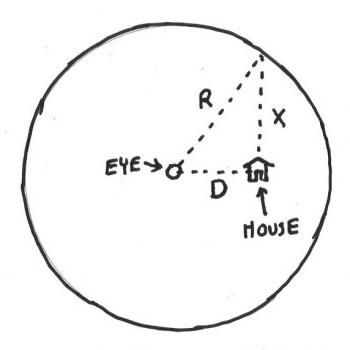
In the diagram, the large circle is the hurricane, the small circle in the middle is the center, or eye, of the storm. D is the closest distance the eye will pass to the house. The variable X will represent the distance the storm travels from the point where the eye is closest to the house until the house is no longer under the storm. That actually means that the house will be under the storm for a distance of 2X (since it travels X miles until it's closest to the house, and then another X miles before the house is out from under it).
The dotted triangle is a right triangle, which means we can use the Pythagorean Theorem to get X in terms of R and D:
X = SQR(R2 - D2) miles
Thus, the storm travels 2X = 2SQR(R2 - D2) miles. Since it is traveling at V miles per hour, the amount of time the house is under the storm is given by this formula:
T = 2SQR(R2 - D2)/V
Applying the Formula
In your case, you want to use the number R = 202.5 (you gave me a diameter of 405 miles, so I cut that in half to get the radius). The speed you gave me was 15 mi/hr, so V = 15. We don't know how close the eye is going to be to your house, so we'll do a worst-case scenario, and assume that the eye passes directly over. That means D = 0.
T = 2(SQR(202.52 - 02))/15 = 27 hours
As a reminder, that is based on data which is likely to change, and the assumption that the hurricane passes directly overhead. It's possible that, as the hurricane gets closer, you'll be able to find tracking information that helps you figure out how close the center of the hurricane will pass to you. If you find that information, you can plug it in to the formula in place of D (measured in miles).
For example, if you heard a news report that said, "Hurricane Irma will pass 100 miles west of city X" you would use 100 for D:
T = 2(SQR{202.52 - 1002))/15 = 23.5 hours
Finally, I'd like to reiterate that this is not provided as a scientific prediction or advice. The only advice I have to share with you is the advice my four-year-old son gave: "I hope Kathryn stays safe!" Please be careful and stay safe, Kathryn, and everyone else in the path of the hurricane!
Follow-up: Read Professor Puzzler's post-hurricane analysis of the formula's accuracy.
Professor Puzzler's PSA: Don't be taken in by Hurricane Conspiracies!
Added note: On my first day back to school with my high school math students, we explored the math question above, plus the following related (and slightly more challenging) problem: How long until the hurricane reaches me? This was a timely way of seeing a real-world application of geometry and trigonometry, as well as an opportunity to talk about hurricanes in general.
"In your post about triangular mountains, you mentioned ice wedging - can you explain what that is?"
Sure! In fact, I'll do better than just explain; I'll also give a picture. First the explanation. Ice wedging is a form of erosion. And erosion, in case you don't know, is when something breaks down due to wind, water, or other natural forces. Erosion can easily be seen on a mountain trail, where water rushes down the side of the mountain (usually in the spring time, but after any heavy rain) and washes away the dirt. This is why, if you're hiking a mountain, you'll often find trails covered with tree roots. The roots weren't always exposed; the rain washed away the dirt until they were sticking out.
This is also why, on many steep mountain trails, the people who maintain the trails will put logs across the trail at intervals, diagonally placed in such a way that water rushing down the trail will be diverted off into a ditch by the side of the trail. These kinds of devices are called "waterbars," because they are designed to bar the water from flowing down the trail and eroding it.
Okay, so that's erosion, and "ice wedging" is a form of erosion. Ice wedging happens when a rock has a crack in it. When it rains, the crack fills up with water. Now, that's not really a big deal, unless that water freezes inside the crack. Since water expands when it freezes, there's not enough space for all that ice in the crack, so the two sides of the crack get pushed apart by the ice, which causes the boulder to shift, and maybe crack some more. If this process happens repeatedly, the crack gradually becomes bigger and bigger, and eventually the boulder may split entirely.
This is very common at high altitudes, where the temperatures fluctuate a lot from day to night; during the spring time there will be lots of rain, and lots of running water from melting snow, but at night the temperatures drop below freezing.
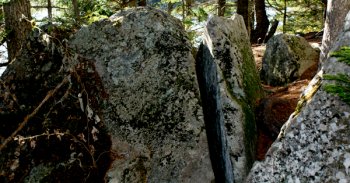
Here's an example of a boulder near the summit of Cranberry Peak in Stratton, Maine, that was probably split due to ice wedging.
Someone told me that on the Richter Scale for earthquakes, adding 1 gives an earthquake 10 times as big. Question 1: is this true?
Then they told me that adding 0.5 does not give an earthquake 5 times as big. Question 2: is that true, and why?
Doreen
Hi Doreen,
To both of your questions, the answer is "Yes."
The Richter Scale is called a "logarithmic" scale, which - for our purposes - just means that a 4.0 earthquake is 10 times as "big" as a 3.0 earthquake. And if you go from a 4.0 earthquake to a 6.0 earthquake, that's an earthquake 100 times as big (multiply by 10 to get to 5.0, and multiply by 10 again to get to 6.0).
("bigness" of an earthquake has to do with the amplitude of its seismic waves).
Regarding your second question, it is tempting to think that if a change of 1 means "ten times as big," a change of 0.5 means "five times as big." But it doesn't work that way.
Let me show you why. Let's talk about a 3.0 earthquake, a 3.5 earthquake, and a 4.0 earthquake.
You know that if you go from a 3.0 earthquake to a 4.0 earthquake, that's 10 times as big.
But if a change of 0.5 meant 5 times as big, then we'd calculate:
From 3.0 to 3.5 is 5 times as big;
From 3.5 to 4.0 is 5 times as big;
Therefore, from 3.0 to 4.0 is 5x5 = 25 times as big! That's not right!
So let's just break down the math a bit.
If you want to go from a Richter scale reading of x to a Richter scale reading of y, you would take the difference of x and y, raise 10 to that number, and that's your "bigness" ratio.
For example, if you wanted to go from 2.0 to 7.0, your ratio is 107-2 = 105 = 100,000.
So let's talk about a Richter Scale difference of 0.5:
Suppose you wanted to go from 2.0 to 2.5. Your ratio is 102.5 - 2 = 100.5. What is 100.5? It's the square root of 10, which is approximately 3.1623.
So if one earthquake has a Richter value of 4.0, and another had a Richter value of 4.5, the 4.5 earthquake is 3.1623 times as big as the 4.0 earthquake.
By the same reasoning, we could figure out how much bigger a 4.2 earthquake is compared to a 4.1 earthquake:
104.2 - 4.1 = 100.1 = 1.2589.


